Weixuan Li
Time and Place: Thursday, 01.07., 13:50–14:10, Room 1
Session: Networks and Spatial Analysis
Keywords: Geospatial network; network visualization; kinship model; art market; Amsterdam
The sudden, meteoric rise of Dutch economic power in the late sixteenth century concurred with the surprising flowering of Dutch art [and the rapid growth of the art market.] In Amsterdam, the large local market and the manifold international trade links nurtured an expanding artist community — over a thousand painters lived and worked there between 1585 and 1700 and pushed the city to its pinnacle of painting production. These Amsterdam artists have attracted many scholars to study their lives and social relations in conjunction with their works. However, the small-scale, art-historical research cannot provide a holistic view of the painter community and their social bonds at large, and therefore the questions of where the seventeenth-century painters lived within the city and how they were connected through family or social ties still go unanswered.
In recent years, the advent of ECARTICO — a biographical database concerning artists in early modern Low Countries — provides an opportunity to bring our understanding of painters’ milieu in Amsterdam to scale, for it systematically documents family ties together with various professional and social relationships. However, to illustrates the social and artistic milieu in Amsterdam using this database, one is inevitably confronted with two challenges. First, like many genealogical databases, ECARTICO records kinship in a tree-structured hierarchy, lacking direct connections among siblings and in-laws (White, Batagelj, and Mrvar 2016). The genealogical kinship model, although suiting studies in anthropology and genealogy, misleads the social economic inquiries into ties of kindred, as the early modern small businesses like a painter’s workshop often involved the extended family (Goosens 2012). Furthermore, ECARTICO’s kinship hierarchy currently intermingles with the flat network of professional relationships, making a family member even more distant than a client in its network.
The second challenge concerns visualizing the social relations within the urban context to highlight spatial patterns. Most network visualizations in (art) historical research did not involve space, presumably because some nodes in the network have no known location or have locations outside the scope. In the case of painters in Amsterdam, some of them are connected through an intermediary painter living in another city.
To tackle these problems and to visualize painters’ social milieu on the map using ECARTICO, I first revised the existing relational model in the biographical databases, turning the tree-structured hierarchy into a network. On top of the kinship remodeling, I further propounded a spatial configuration that folds networks in space, transforming the relational web into a social distance matrix that can be plotted onto the map.
Data
The main source is the ECARTICO database, which is built on a wealth of archival sources and literature, providing a comprehensive collection of structured biographical data concerning the ‘cultural industries’ of the Low Countries in the sixteenth and seventeenth centuries. ECARTICO contains data on 50,412 persons with 9219 painters in its collection (as of February 14, 2020). In particular, ECARTICO documents more than 30,000 relations and contains over 9000 addresses, an abundance of social and locational information that has yet been used in existing research. As a case study, I experimented with the 129 painters who became active in Amsterdam between 1585 and 1610.
Method
Remodeling family relationships
I first modified the tree-structured family ties into a kinship network by adding the missing links among the family members. Siblings, half-siblings, and in-laws are calculated or inferred from the existing relational data in order to complete the family network that matters for small family businesses in the early modern time. This method, albeit simple, can help transform many biographical databases to fit the historical network analysis without altering the original data. In this way, more biographical and genealogical databases will become suitable for network analysis.
Folding social network spatially
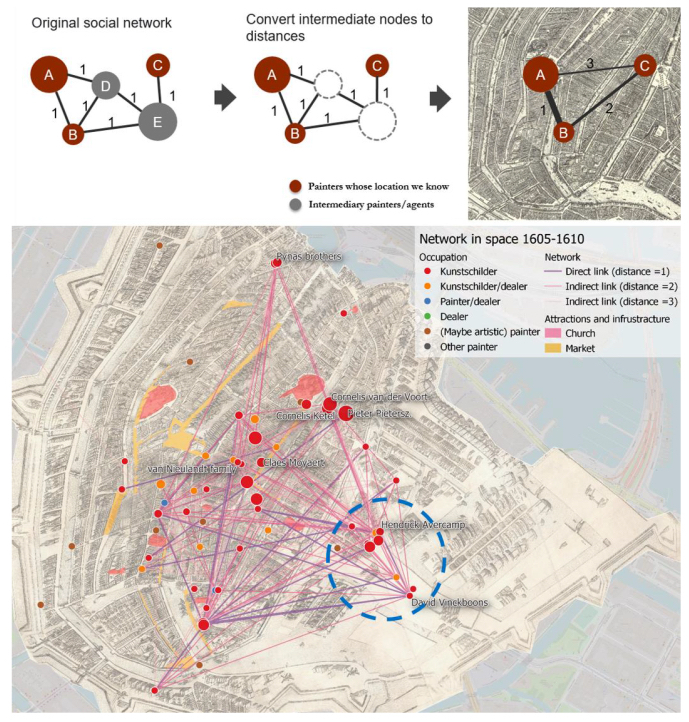
To map the social network with intermediate nodes falling outside the city, I introduced a method that folds up the social network spatially. Figure 1 illustrates a network with painters who can be geo-coded (in red) and intermediate people who cannot be mapped (in dark gray). The size of the nodes is proportional to the number of connections he/she had (or the degrees) in the original network. The distance between any two adjacent nodes is marked as one in the original network. Then, the intermediaries are dropped, and the distance between the two geo-coded nodes in the original network becomes the weight of the new direct link between the two. In the folded network, for instance, node A and C are now linked with a weight of 3, indicating a much more distant relation than node A and B, who have a direct connection with a weight of 1. In this way, the social network of painters in Amsterdam can be layered over the maps without losing the shape of the original network. Figure 1 shows an example of visualizing social connections among painters and art dealers in Amsterdam between 1605-1610.
Results and discussion
When I first set out to map artists and their social relations in Amsterdam, I expected to find clusters of socially-bonded painters scattered in various locations with only few brokerage ties connecting groups that are both socially and spatially demarcated. Nevertheless, Figure 1 presents an integrated painters’ community regardless of their places of residence. The painters’ circle, as we see on the map, leaned towards the east side of the city, on Sint Antonisbreestraat, where a new artistic cluster was burgeoning (blue circle). The artists who settled there, according to the network in Figure 1, are among the best connected, and they seem to have been pulling the whole community to the newly developed area, an area that would soon become an artistic center in the city and which would house Rembrandt decades later. Through this exercise, I hope to showcase the potential of geospatial network representation, using the revised kinship model, to smooth scholarly reading of the maps and to derive a historical narrative at scale.
Works cited
Goosens, Marion E. W. 2012. De Noord-Nederlandse kunsthandel in de eerste helft van de zeventiende eeuw. Uitgeverij Verloren.
Mayr, Eva, and Florian Windhager. 2018. “Once upon a Spacetime: Visual Storytelling in Cognitive and Geotemporal Information Spaces.” ISPRS International Journal of Geo-Information 7 (3): 96. https://doi.org/10.3390/ijgi7030096.
White, Douglas R., Vladimir Batagelj, and Andrej Mrvar. 2016. “Anthropology: Analyzing Large Kinship and Marriage Networks With Pgraph and Pajek.” Social Science Computer Review, August. https://doi.org/10.1177/089443939901700302.